

The University City District‘s annual report released this week shows that an upward trend in construction that began in 2021 will icrease dramatically in 2023, with more square footage of commercial and residential development under construction than in any year since the report began in 2002.
The “State of University City,” a yearly snapshot of development trends in the area roughly bounded by the Schuylkill River to the east, 50th Street to the west, Market Street/Powelton Avenue/Spring Garden Street to the north and Woodland Avenue/University Avenue to the south, also shows a slight increase in public transit use compared to last year. But ridership is still roughly half that of pre-Pandemic levels on trolleys and the Market-Frankford Line.
The report includes data from 2022 and building projections for 2023. Office vacancy rates in University City average 9.8 percent, about half of the vacancy rate in Center City and the second lowest in the region (Main Line, 9.7 percent). Average rent for office space has increased 18 percent since 2020 to $49.26 per square foot.
Residential property prices and rents have steadily increased since 2010 (other than a dip in home prices this year). Home prices average $287 per square foot, about $100 more than the city average. The Spruce Hill neighborhood has the area’s most expensive homes, averaging just under $600,000 per home.
Notably, for the first time average home prices in the neighborhoods that comprise the University City District – Cedar Park, Garden Court, Powelton, Spruce Hill, Walnut Hill and West Powelton – all have average home prices above $250,000, according to the report.
The average rent for a one-bedroom apartment in those neighborhoods is $1,350, with prices in the Garden Court neighborhood, which had the lowest rents in the District two years ago, now the highest at $1,850.
The report does not include demographic information related to race or ethnicity. The full report is available here.
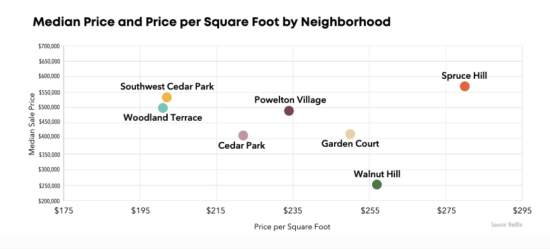
A chart showing median home prices in several of the neighborhoods that make up the University City District. From the annual State of University City report.
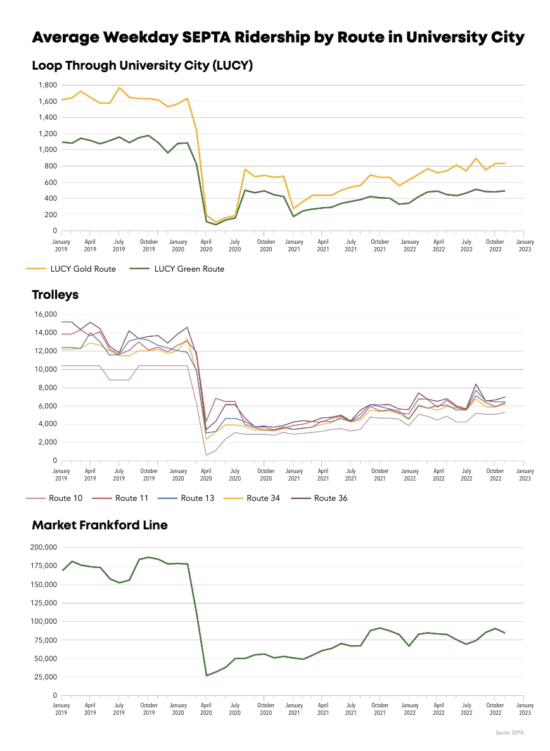
Public transit ridership remains well under pre-Pandemic levels, according to the report.


Recent Comments